VouchDashBoard exposes a separate window containing visualization of data collected from different sources coupled with text, images, colors, fonts etc. It is a powerful tool to monitor minute-to-minute activities happening in the organization in a visual way.
In this chapter we will discuss:
1. How to design a dash-board,
2. How best it can be exploited for the upper, middle, and lower management,
3. How best it can be exploited to present on-site offers to the customers,
4. How it can be exploited as a price-checker equipment, etc.
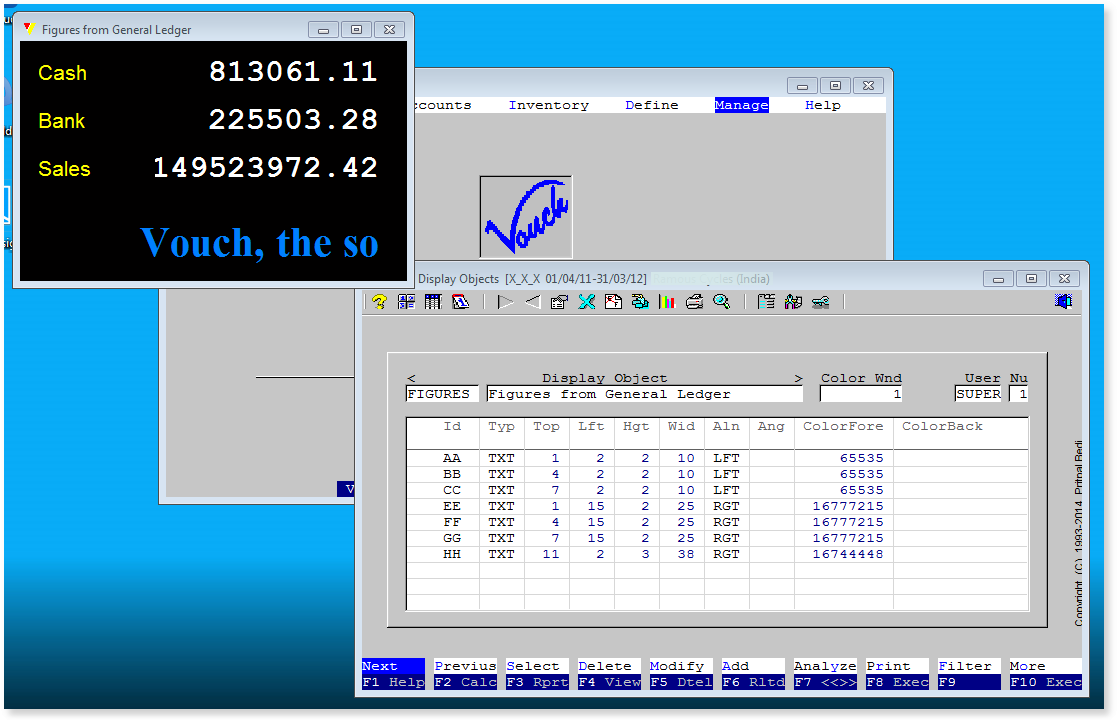
Below is the image of a simple dash-board containing few figures from the General Ledger and a banner. Figures are defined to be refreshed every few seconds.

A view of a very simple VouchDashBoard containing figures from <General Ledger> module being refreshed every few seconds.
